InfluxDB / Grafana
In this chapter we explain first DashT helper-script usage of Docker container based server execution to make InfluxDB time series database easily available. In the second part we give necessary information for those who want to do the installation their way and give an overview to the usage of an external time series visualization tool called Grafana.
NOTE: You are not obliged to run InfluxDB time series database while underway - you can also stream all data into a so-called Line Protocol File which can be loaded into an InfluxDB DB back home. If only few data sources are needed, one can record some data sources in a CSV-file with history graph instruments for off-line analysis. But the provided helper script method based InfluxDB / Docker makes it so easy to use that you do not want to miss the new services which can be built around having near-term historical data - all data - at your disposal, like on Grafana dashboards.
Introduction
Influx data’s InfluxDB 2.0 is time series database which can be used directly for data analysis or used as a middleware for data analysis or monitoring software. A data streaming connector has been developed between DashT for OpenCPN v5 plug-in and this popular time-series database platform. Most natural usage is to export all data received by the plug-in into Influx DB 2.0 with the millisecond time stamps of DashT.
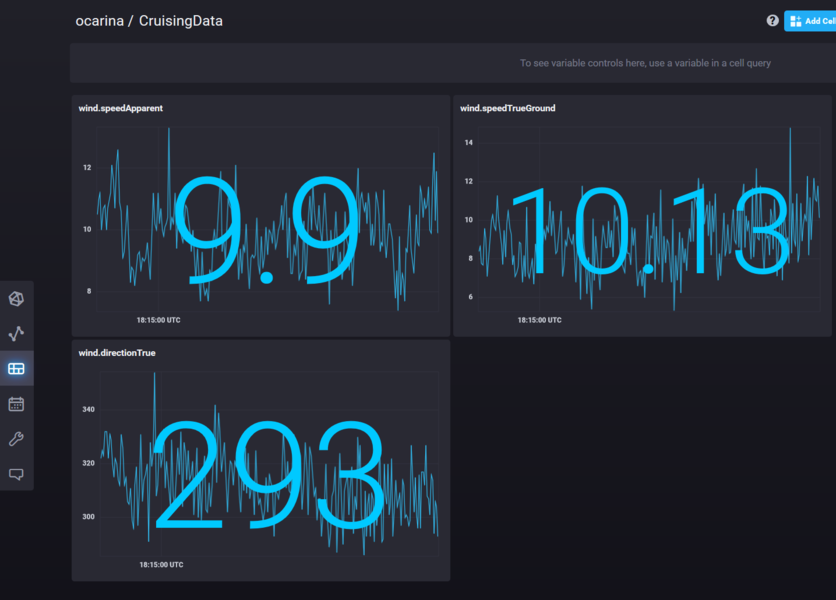
Once the all data is stored, it can be used to wide variety of usage, either immediately or extracted for off-line analysis. Here is an example of dashboards, familiar from Grafana but here provided by the InfluxDB 2.0 offering instant retrieval and analysis services for live data:
Docker InfluxDB
Docker (Docker Desktop for Windows and Mac) is a popular framework to containerize applications. Shortly, a “container” is a mini-operating system, often Linux based running one single service, usually network based. The container is running under Docker or Docker desktop and you would communicate with the application over the network. The application can be made to see your file system so that you can share data with it without going through the network.
NOTE: Why there is no DashT Docker container? Simply because it would make yet another build to maintain and yet another dependency. Instead, standard and latest service containers can be used and configuration scripts for those are provided with DashT installation package and explained below.
TIP: You can try and not to stop InfluxDB using the helper scripts below when you stop your system; normally, at next restart Docker will restart all the services. But on Windows systems, do not leave your system too long time off, without restarting the InfluxDB using the provided script - it synchronizes the clock only this way on Windows.
Windows scripts
The helper scripts to start and stop the Docker based InfluxDB, Grafana and nginx web server are provided with DashT. The supporting configuration files are installed in \Users\Public\DashT folder. Two buttons are installed on the Desktop:
Start DB (database and web services)
Stop DB
All you need to do to make the buttons work is to install yourself Docker Desktop and start it - following the DashT maxim “if you do not want it, you will not get it”, no third party software is installed by DashT installer so that you can keep the control.
NOTE: the helper scripts have been developed and tested for Docker Desktop v3.3.3. By default the latest InfluxDB is installed, while the tests have been carried out with InfluxDB v2.0.6.
TIP: If Docker Desktop announces that our system is Hyper-V compatible (Windows 10 Pro only) but suggests to use WSL 2 it is not recommended for these applications: InfluxDB, Grafana and nginx will all have part of their filesystems mapped back to local Windows file system in the Public folder. This has been reported to work in less optimal way and even a warning about it given by Docker Desktop v3.3.3. Hyper-V is preferable here.
Linux scripts
The Linux version of the above is the helper script dashtdb - you would use it from the command line:
you@yourlinux:~$ dashtdb

dashtdb - Launching Docker based services for DashT: nginx, infludb, grafana
Usage:
      dashtdb [start|up]
      dashtdb [stop|down]
NOTE: we let fans of GNOME3, KDE, LXQT, xfce4 and alike to create their own desktop buttons!
The same way, like on the Windows counterpart the principle “only if you want it you will get it” is respected; no third party software is declared as automatic dependency in the DashT package installation. Only if you launch the dashtdb script and if the supporting software is not there, you will be asked do you want to get it installed. This way, a person who is not interested in database functions will not get database software installed for nothing.
Third-party programs installed by the script - with your permission:
dashtdb script needs:
docker, docker-compose
InfluxDB v2.0, Grafana, nginx web server
Set up InfluxDB
There is no reason to repeat InfluxDB v2.0 documentation here. But setting up the database for your boat is dead easy already from the welcome screen of InfluxDB 2.0, which is now at http://127.0.0.1:9999, or in http://host.docker.internal:9999 if you prefer. The guidance for the first time configuration is excellent! You will need to give:
User name and password
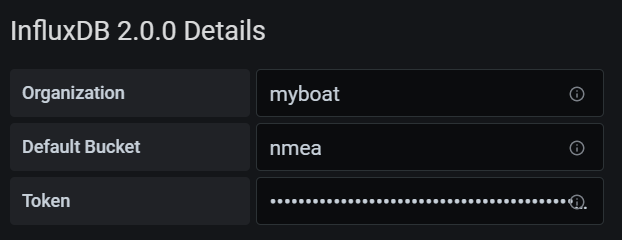
Organization name - like the name of your boat
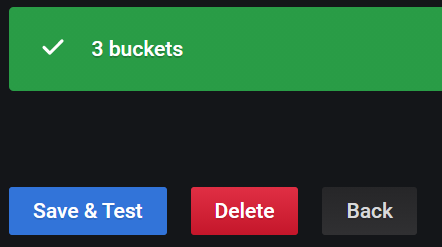
“Bucket” name - this is where the data is going to be dropped into, give it a name like “nmea”, why not
If you plan not to use streaming or reading back of data, just file-based data storage when underway and its feeding into the database when back in the safe harbour, you are done. You would use, later on this very same interface to upload the data file into the database, into the bucket you have created. Database service itself does not need to run, in this case when you are underway, DashT InfluxDB Out is enough.
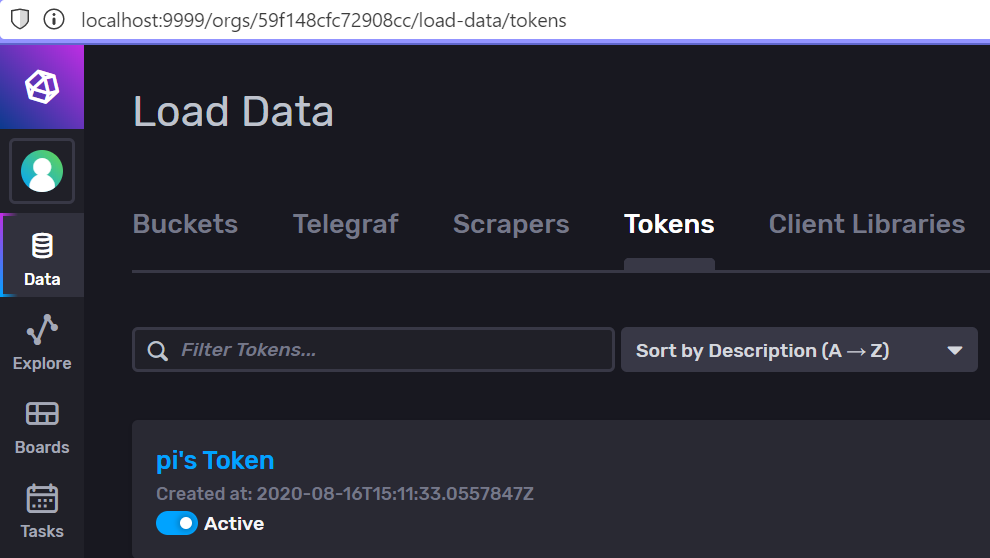
However, streaming data in live into the database and reading it back live requires a token (your username and password are never asked in data communication):

Give the token in InfluxDB Out instrument’s configuration to enable HTTP-based real-time write/read operations between DashT and InfluxDB v2. You would need to keep the database container running, in this case when underway.
InfluxDB storage
In this solution with Docker, with DashT configuration scripts data is stored on your computer, the same one which is hosting Docker.
Windows: C:\Users\Public\DashT\influxdb2
Linux: ~/.opencpnplugins/dashboard_tactics_pi/instrujs/influxdb2
You may want to back up or otherwise keep these directories safe if you want to keep long-term archives of the data. DashT cannot guarantee the integrity of the data since this directory is totally under control of Docker/InfluxDB.
TIP: On Linux you can relink this directory to an external device, such as USB3-connected disk to reduce the load to your system disk against repetitive small chunks of writes (if your system disk a semiconductor storage device) and for backup purposes. (On Windows, Docker will most likely have no permission to write to the device which is out of Public or user’s folders.)
InfluxDB backup
By nature, the InfluxDB time series database is considered to have a retention policy which can be set for each bucket - or set to keep the data “forever”. It can be interesting to have backups if one accidentally does not deal with or does not have time to analyze the data before it is deleted. One can take the advantage of the local file systems mounted by the DashT scripts and take a backup on that file system. The backup is taken with the InfluxDB CLI, which on Windows can be opened using a container controller button on the Docker Dashboard.
# influx backup \
> /var/lib/influxdb2/backup_$(date '+%Y-%m-%d_%H-%M') \
> -t 4YSbL.....DOAoO9A==
Where the -t is your InfluxDB administrator’s token and not only a token for a single bucket since you are making a backup of all data here.
To restore our (example) bucket nmea (which cannot exist in the target database) with data from a previous backup:
influx restore \
   /var/lib/influxdb2/backup_2021-06-20_18-04 --bucket nmea \
   -t 4YSbL.....DOAoO9A==
For more information about backup and restore, see InfluxDB v2.0 documentation.
Grafana
Grafana is an open source analytics and monitoring solution for almost every database based data, including InfluxDB v2.0. DashT bundles this popular and easy-to-use visualization solution it in its Docker ready-to-launch configuration albeit it does not use it, in any way in OpenCPN. For your convenience, DashT sets up you few essentials needed to work both with Docker and with a InfluxDB v2 container.
With Grafana we want to use a separated volume to share it settings and other parameters in persistent manner, provided that we need to delete and restart the container. The volume is located in local file system as defined in docker-compose.yml (see above).
NOTE: To help with the data retrieval from the InfluxDB v2 time series database, DashT Docker helper scripts are installing in the mounted, local file system for Grafana, in its
pluginsfolder InfluxDB (Flux) Datasource (grafana-influxdb-flux-datasource) to make the data retrieval possible by a simply data source selection.
Grafana needs two network connections now: one to talk with you (or rather with your browser). All the settings are done in the above configuration file but perhaps it is more clear to look at the resulting container settings with Docker: docker inspect dasht_grafana:
"Ports": {
    "3000/tcp": [
        {
            "HostIp": "0.0.0.0",
            "HostPort": "30000"
        }
    ]
},
This is the port Grafana is listening. Point your browser, in this case to http://localhost:30000 (chosen not to get mixed with Signal K server node port 3000).
Second interface is to Docker: please Docker, let me talk to the InfluxDB database container… Again, this is set in the above configuration file as db link, but let’s see what Docker reports about in with the above docker inspect command:
"Networks": {
    "dasht_default": {
        "IPAMConfig": null,
        "Links": [
            "dasht_influxdb:dasht_influxdb",
            "dasht_influxdb:db"
        ],
        "Aliases": [
            "graphs",
            "e965d09373b1"
        ],
Therefore, in Grafana container we can reach the neighbouring InfluxDB v2 container either with a URL http://dasht_influxdb:9999 or with its alias http:://db:9999.
To make confusion total, the newer version of Docker Desktop 3.x requires a pseudo host name http://host.docker.internal:9999.
Armed with this knowledge, we can configure Grafana’s InfluxDB (Flux) Datasource.
NOTE: (When this is written May 2021) Grafana’s InfuxDB data source plug-in says that Flux support is stil in beta. Therefore we use Influx’s own (beta) which DashT installs by default. The situation is likely to change, hopefully the interface will not change too much and the below remains applicable.

Enter the settings you need to collect from InfluxDB v2 (you can have another tab/window open in http://localhost:9999):

If you use the default URL, like `http://127.0.0.1:9999’ to connect to InfluxDB v2, you will get an error:
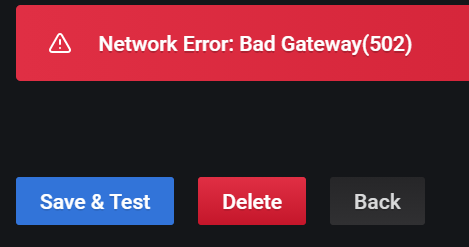
… or similar, depending of the Docker Desktop version you are using (2.x or 3.x).
You need to access the InfluxDB v2 through the Docker provided container-to-container link. DashT script has given it an alias db (of course!). Port remains the same 9999 (we are not going through the proxy server.)
Docker Desktop 2.x: Give URL
http://db.9999, the alias
Docker Desktop 3.x: Give URL
http://host.docker.internal:9999, which then translates in Docker as ‘local host’.

Success.

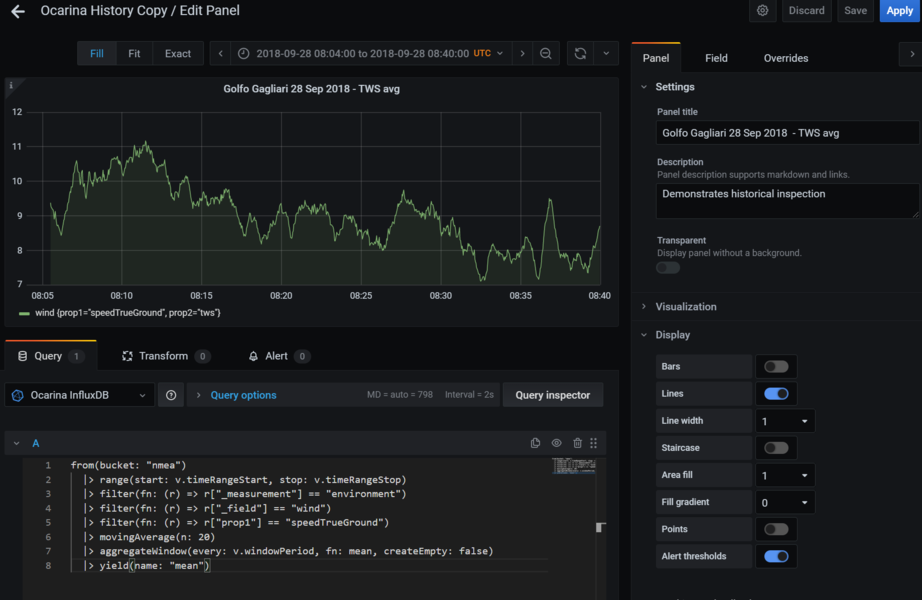
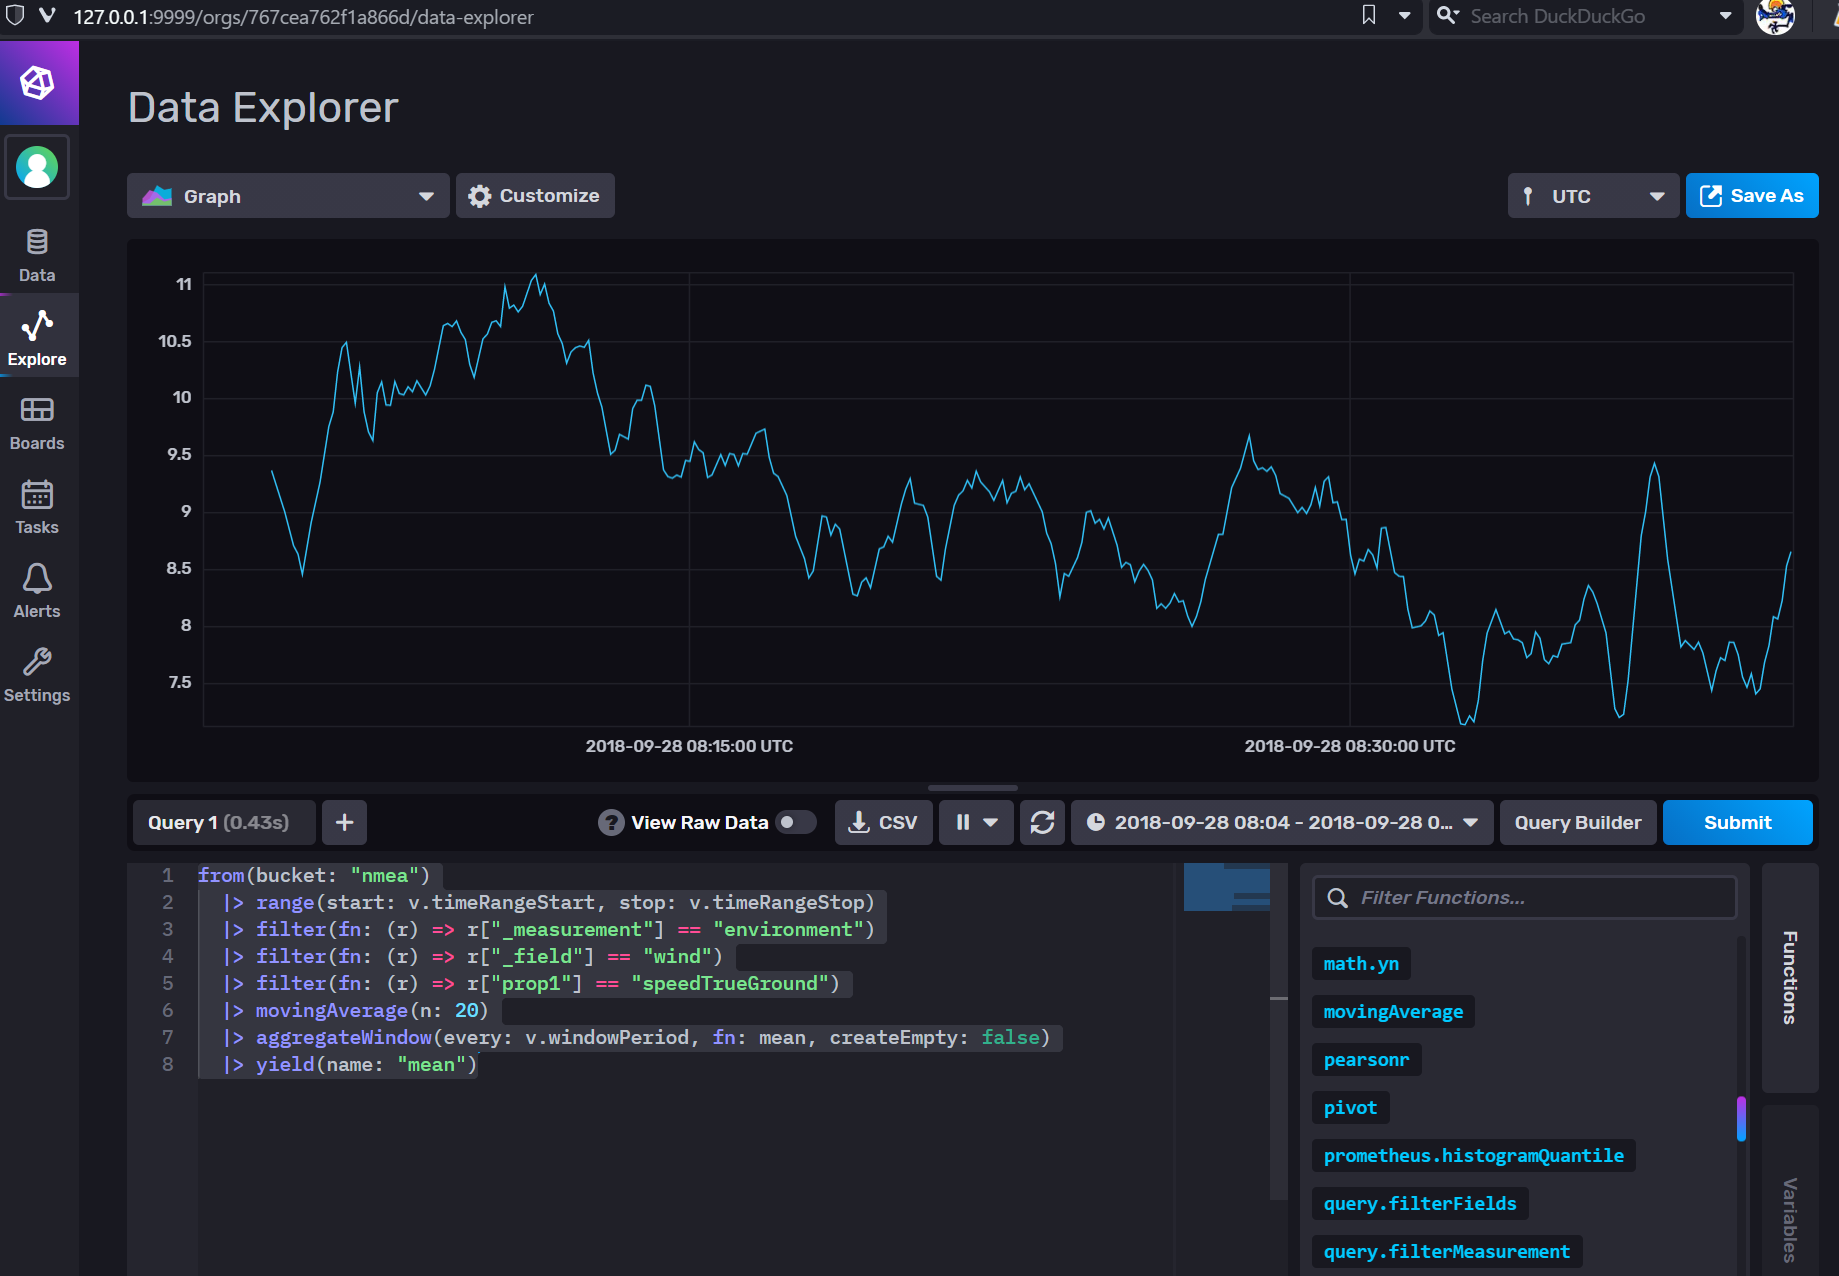
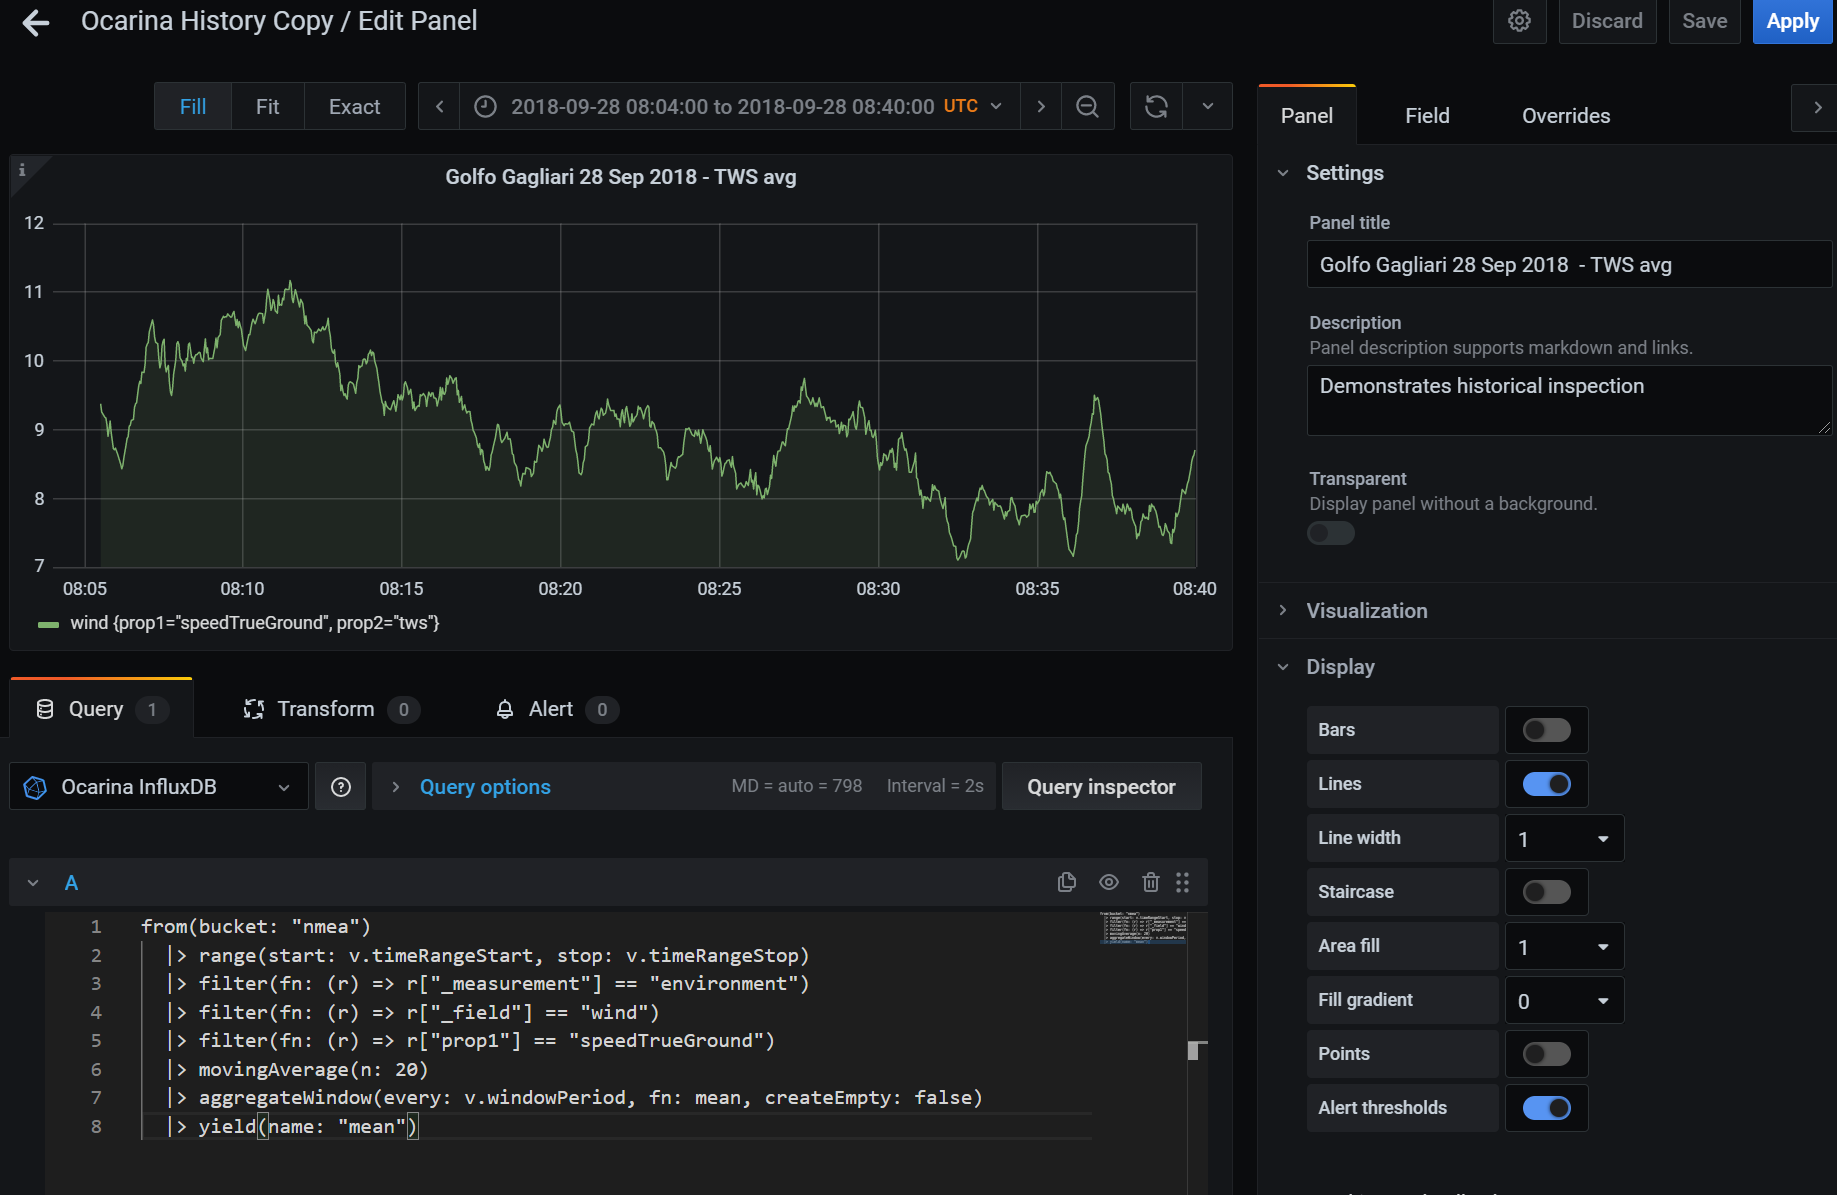
We need some data now and some Flux code to request for it. Let’s first collect some data in InfluxDB. Here we select TWS.

If not familiar with Flux language (who is?) one can easily get a good example with the InfluxDB Script Editor, here for the above screen, one just switches from the click-based selection for inquiry builder to the Script Editor in the above example.
NOTE: there are variables used by InfluxDB which one cannot copy as such to the other program, such as Grafana. We need to remove those and either use Grafana’s variable or avoid using them. Here’s the code with only one variable in Grafana,
nfor the limit of the samples to collect.
from(bucket: "nmea")
  |> range(start: v.timeRangeStart, stop: v.timeRangeStop)
  |> filter(fn: (r) => r["_measurement"] == "environment")
  |> filter(fn: (r) => r["_field"] == "wind")
  |> filter(fn: (r) => r["prop1"] == "speedTrueGround")
  |> movingAverage(n: 20)
  |> aggregateWindow(every: v.windowPeriod, fn: mean, createEmpty: false)
  |> yield(name: "mean")
The above code has been generated in the InfluxDB Explorer and it can be cut and pasted to Grafana Dashbaord. It is used, almost the same but with shorted sliding time in the DashT instrument Line Chart). You can therefore make your choice for the presentation tool, the data and its retrieval remains the same!
Grafana provides all sorts of debugging tools, such as Query Inspector which are extremely helpful if something goes wrong. It is unfortunately impossible to rewrite here all the knowledge one can certainly find in Grafana documentation or just by trying things out. Grafana is some pretty powerful piece of software, which is used for Data Center management etc. so do not get frustrated too quickly but experiment. Some nice winter fun!
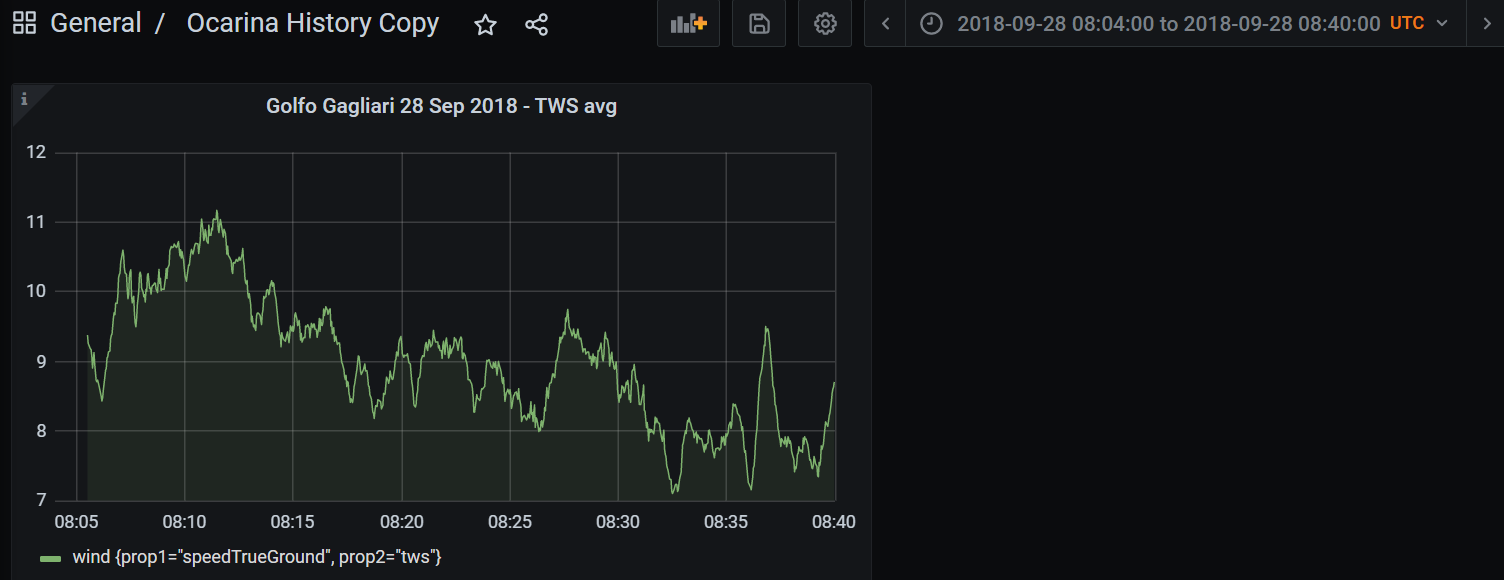
Finally, if you have a big screen in your boat, nothing prevents to put you tens of graphical instruments on it’s mighty real estate area. In this example there is only one humble Grafana dashboard instrument:

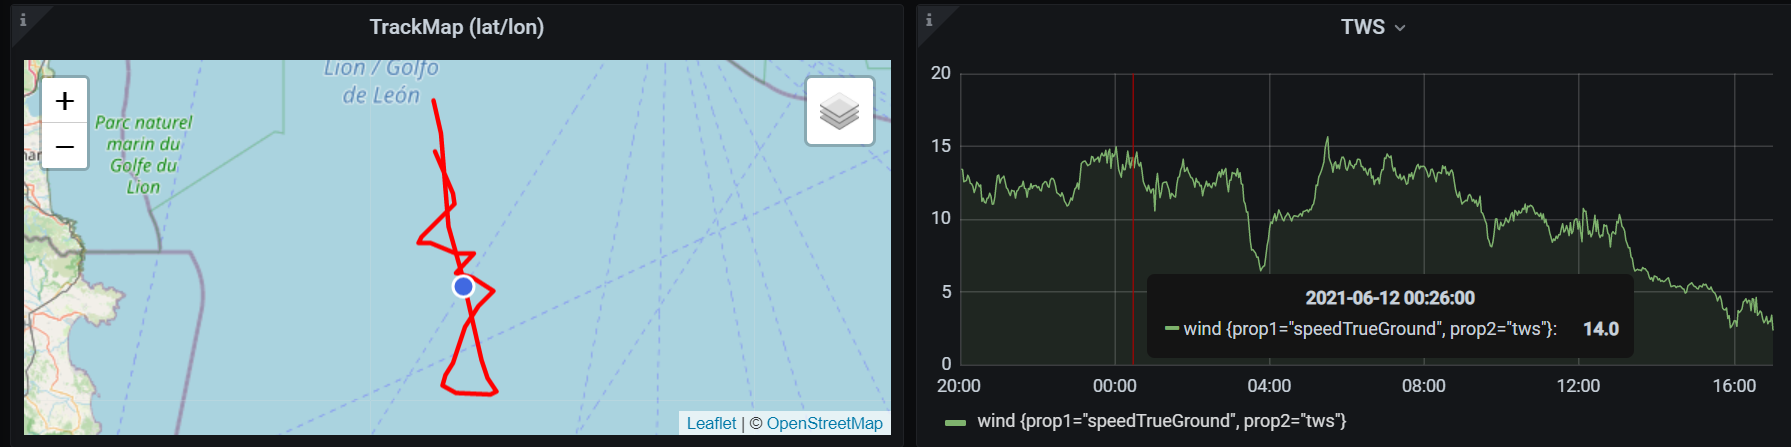
With Grafana plug-ins, the possibilities are endless. In the below example, we have one panel which makes inquiry for position data but also for True Wind Speed (TWS). When browsing historical data, one can position the pointer on the wind data and, using TrackMap plug-in for Grafana, show the position on which the wind condition occurred.

Going back in the history, even before the times the DashT existed is possible with InfluxDB Out tools for conversions, such as conversion of a VDR-playback stream, allowing DashT Tactics Polar calculations to be applied, even retrospectively! Let’s move a few years back and use a Grafana dashboard for performance analysis to wonder it took us so long to react to an important wind shift by rolling back that part, from InfluxDB v2.0 with the following Grafana dashboard:
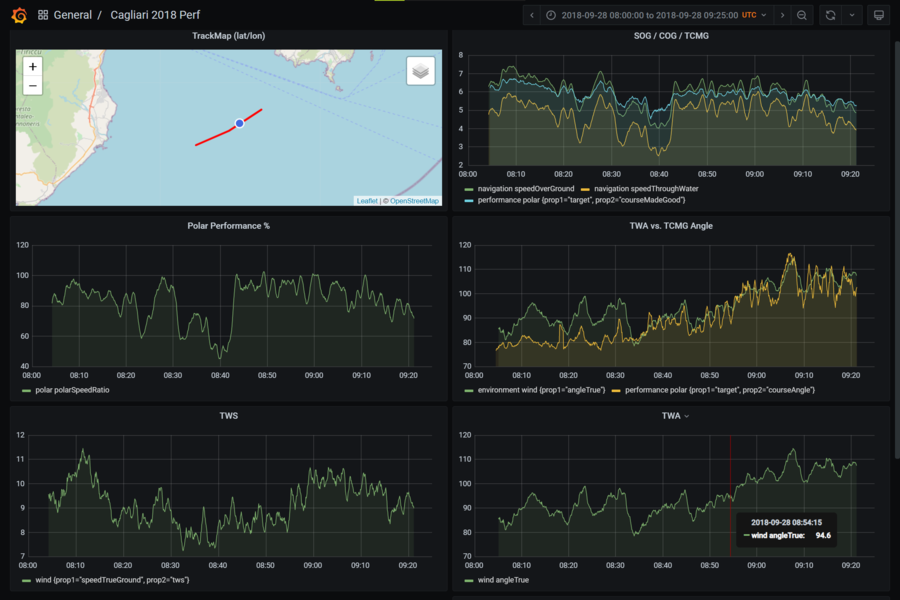
There is a dedicated developer’s corner which collects information how the above panels have been set up, including the Grafana dashboard’s JSON-configuration files.
HTML/JS updates
HTML and JavaScript for the Engine/Energy and other web based instruments are available, in default nginx configuration in port 8088. This way, you do not need necessarily run a specific server on port 8080 for Engine and Energy instruments using its own helper script. Of course, you need to change the port also in the configuration file of OpenCPN, see Tweaks.
Windows: Update of DashT (i.e. reinstalling with installation
.exeupdates the folderC:\Users\Public\DashT\wwwfrom where the ngingx is serving the HTML/JS files for the instruments.
Linux: Update of DashT does not update HTML/JS files in
~/.opencpnplugins/dashboard_tactics_pi/instrujs/www- they are copies of the distribution’s files. After an update of DashT, it is enough to remove the folderwwwin the above user path and launch thedashtdbscripts, which will recreate the folder and copy the updated HTML and JavaScript files into it.
Under the hood
This section you may want to read only when things do not work for you, for simple curiosity or if you want to do the things yourself - maybe you have a Mac and the above scripts are not available for you (but you can maybe contribute by modifying the Linux scripts as a starting point).
Docker Dashboard

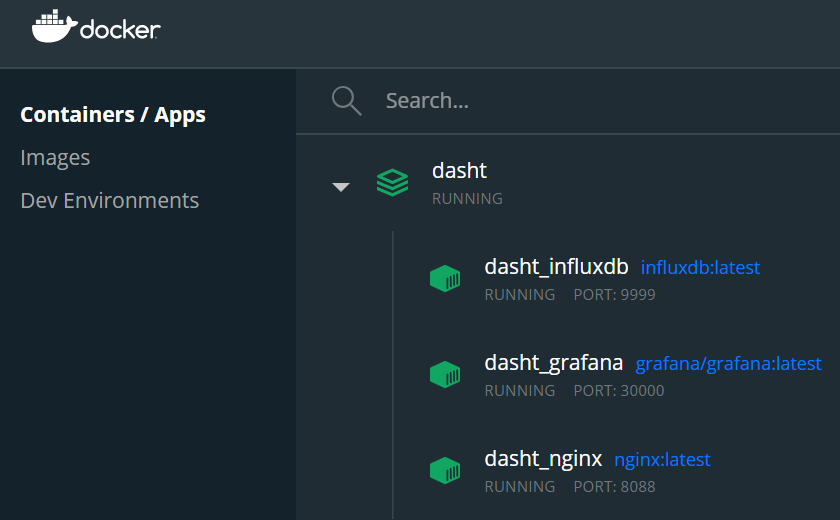
Use Docker Desktop’s Dashboard to view the three containers created by the above helper scripts, providing three useful services:
nginx - this is the HTTP / proxy server, a Swiss knife providing both files to OpenCPN’s DashT but also connecting it to other network based services, and interconnecting those services
InfluxDB v2 - time series database which both collects data from DashT but which is also available to feed it back to DashT but also to other useful services:
Grafana - A monitoring solution which allows you to create more complex dashboards that would be possible with DashT or with InfluxDB v2.
NOTE: We do not run a Signal K server node in Docker - it may require some physical connection like USB and it is better done with Node.js which is also network performance-wise a better solution than running it in a Docker instance. For testing and learning purposes it is, of course, possible to run Signal K as a Docker instance as well.
Command line is the same both for Linux or Windows (and probably for Mac):
you@yourlinux:~$ docker container ls

Container creation
Containers are created using the following type of container definition (example from Windows, in Linux version only the file system mount points do change), the file is named in both docker-compose.yml:
version: '3'
services:
  web:
    image: nginx:latest
    container_name: dasht_nginx
    depends_on:
      - db
    volumes:
      - /c/Users/Public/DashT/nginx/nginx.conf:/etc/nginx/nginx.conf
      - /c/Users/Public/DashT/www:/data/www
    ports:
      - 8088:80
      - 8089:8089
  graphs:
    image: grafana/grafana:latest
    container_name: dasht_grafana
    depends_on:
      - db
    links:
      - db
    volumes:
      - /c/Users/Public/DashT/grafana:/var/lib/grafana
    ports:
      - 30000:3000
  db:
    image: quay.io/influxdb/influxdb:2.0.0-beta
    container_name: dasht_influxdb
    volumes:
      - /c/Users/Public/DashT/influxdb2:/var/lib/influxdb2
    command: influxd run --bolt-path /var/lib/influxdb2/influxd.bolt
    --engine-path /var/lib/influxdb2/engine --store bolt --reporting-disabled
    ports:
      - 9999:8086
The description files define all the steps that one would need to either to type manually or set up using Docker Desktop. Now it is automatic every time you use the DashT stop/start scripts!
NOTE: On Windows systems, the start-up scripts of DashT also synchronize the InfluxDB container’s clock with the local CPU clock. This is needed because on Windows, the clock is provided by Hyper-V virtualization. And when you are not running any containers that clock is not running… For this reason, it is extremely important to synchronize your CPU time to a reliable data source (like GPS, when underway).
You can observe that both network ports, dependencies and mount points in local file system have been defined. If you need or want to do the work manually, the above description can be used as a starting point for what is needed.
nginx
nginx engine x is an HTTP and reverse proxy server. It is a true Swiss knife, allowing us to provide and share all services local, like http://localhost:8088 - we need more services, we just add port numbers. With nginx’s rirch features and high its reverse proxy we can
Make DashT network based files available as network service from the local file system, the same in which OpenCPN is installed - no copying is needed
We can make the code in those files to access InfluxDB v2 in parallel with your browser and with Grafana by enabling CORS (Cross-Origin-Resource-Sharing) so that browser security features gets satisfied
NOTE: without a CORS-enabling proxy it is impossible for a web-based application like JavaScript instruments of DashT to read/write into InfluxDB or other web service since they are not originating from that very same web service. However, InfluxDB Out is not affected by this so if you do not use JavaScript instruments, you can omit the CORS-enabling proxy.
We want nginx to configure two local port, to act as proxy server and to deal with CORS so that the localhost served JavaScript files can access services such as the InfluxDB v2 - same thing for Grafana, let it access InfluxDB v2 :
port 8088 - is mapped in Docker container as port 80, bind back to the host’s local file system so that DashT provided
wwwdirectory (instrument HTML5/JavaScript) can be servedport 8089 - is a proxy for files served from 8088 wanting to access influxdb server - CORS Access Control headers are replied to browsers confirming them that this is OK - tested Chrome 80, Firefox 74 and even IE11 (because WebView of wxWidgets is using it).
user  nginx;
worker_processes  1;

error_log  /var/log/nginx/error.log warn;
pid        /var/run/nginx.pid;


events {
    worker_connections  1024;
}


http {
    include       /etc/nginx/mime.types;
    default_type  application/octet-stream;

    log_format  main  '$remote_addr - $remote_user [$time_local] "$request" '
                      '$status $body_bytes_sent "$http_referer" '
                      '"$http_user_agent" "$http_x_forwarded_for"';

    access_log  /var/log/nginx/access.log  main;

    sendfile        on;
    #tcp_nopush     on;

    keepalive_timeout  65;

    #gzip  on;

    server {
      listen 80;
      location / {
        root /data/www;
        autoindex on;
      }
    }
    server {
      listen 8089;
      # https://enable-cors.org/server_nginx.html
      location / {
        # InfluxDB query, read
        if ($request_method = 'OPTIONS') {
            add_header 'Access-Control-Allow-Credentials' 'true' always;
            add_header 'Access-Control-Allow-Methods' 'GET, POST, OPTIONS';
            add_header Access-Control-Allow-Origin $http_origin;
            add_header 'Access-Control-Allow-Headers'
            'Authorization,Accept,Origin,DNT,User-Agent,X-Requested-With,
            If-Modified-Since,Cache-Control,Content-Type,Range';
            add_header 'Access-Control-Expose-Headers' 'Content-Length,Content-Range';
            #
            # Tell client that this pre-flight info is valid for 20 days
            #
            add_header 'Access-Control-Max-Age' 1728000;
            add_header 'Content-Type' 'text/plain; charset=utf-8';
            add_header 'Content-Length' 0;
            return 204;
        }
        # InfluxDB query, write
        if ($request_method = 'POST') {
            add_header 'Access-Control-Allow-Credentials' 'true' always;
            add_header 'Access-Control-Allow-Methods' 'GET, POST, OPTIONS';
            add_header 'Access-Control-Allow-Headers'
            'Authorization,Accept,Origin,DNT,User-Agent,X-Requested-With,
            If-Modified-Since,Cache-Control,Content-Type,Range';
            add_header 'Access-Control-Expose-Headers' 'Content-Length,Content-Range';
        }
        if ($request_method = 'GET') {
            add_header 'Access-Control-Allow-Credentials' 'true' always;
            add_header 'Access-Control-Allow-Methods' 'GET, POST, OPTIONS';
            add_header 'Access-Control-Allow-Headers'
            'Authorization,Accept,Origin,DNT,User-Agent,X-Requested-With,
            If-Modified-Since,Cache-Control,Content-Type,Range';
            add_header 'Access-Control-Expose-Headers' 'Content-Length,Content-Range';
        }
        proxy_redirect off;
        proxy_set_header host $host;
        proxy_set_header X-real-ip $remote_addr;
        proxy_set_header X-forward-for $proxy_add_x_forwarded_for;
        proxy_pass http://host.docker.internal:9999;
      }
    }
}
NOTE: To read InfluxDB v2.0 database, the client shall use OPTIONS-method, not GET-method which will be rejected. Therefore the CORS-proxy function is implemented only for OPTIONS-method. It is noteworthy also that InfluxDB Out will not need to go through the proxy, it can POST directly the data into the TCP/IP port 9999 of the server. But if a JavaScript client needs to do the same, it needs to go through this proxy and the POST-options needs to be implemented with the CORS-proxy functions.
It is nice to be able edit directly the nginx’s configuration file without sometimes complicated tricks. That’s why we bind it to a local file system file as well.
TIP: In Windows Docker Desktop 3.3.3. we use
proxy_pass http://host.docker.internal:9999instead ofproxy_pass http://dasht_influxdb:9999: while the name resolving worked in earlier versions, in this version one needs to refer to Docker host which then resolves the address. Otherwise a 502 bad gateway error will be returned by ngingx in this configuration.
InfluxDB read-back
While Grafana is the suggested dashboard tool for on-board and on-line usage of data, the InfluxDB API provides multiple possibilities for developers for on-line and off-line data retrieval for further analysis. While the development details are out of the scope of this document, we can list the following links for those who are interested to get more information:
JavaScript/TypeScript: DashT Line Chart is a Grafana-wannabe line history drawing instrument using InfluxDB’s TypeScript API to retrieve the data. You can find the corresponding module here
Python Panda DataFrames are most convienent to analyze and plot the data off-line. Please see this folder in the development repository
Troubleshooting
Troubleshooting is done best with nginx server using an ordinary browser, by attempting to open the aforementioned ports 8088 (you would expect to find DashT JavaScript instrument’s home directory to load the HTML5/JavaScript code) and port 8089 (with InfluxDB v2 running on port 9999 you would expect to drop on it’s login page).
All browsers contain debug tools, for example if you want to open any DashT JavaScript instrument’s index.html page you can get good information in case of eventual issues with the page loading like that. Please see the troubleshoot section of EngineDJG.
In case you do not get connected anywhere, it would be worthwhile to open a console on the Docker container which is providing the nginx service.
NOTE: On Windows, you may have left the services running when shutting down, in which case the containers are started automatically. However, one cannot connect to them with Docker tools unless you have also Docker Desktop running. This, you may have selected not to start automatically. If this is the case you need to start it now.
TIP: On Docker Desktop for Windows one has a button
Logswhich allows to see similar information as below in case one does not like the command line.
Check first that you have, indeed the containers still running:
docker container ls
From command line, attach the console to the dasht_nginx container:
docker container attach dasht_nginx
Try to reach the above connections (ports) again and observe the console. It should say, if working correctly access to all ports (or error messages if an issue):
172.20.0.1 - - [07/Sep/2020:09:54:59 +0000] "GET / HTTP/1.1" 200
1301 "-" "Mozilla/5.0 (Windows NT 10.0; WOW64) AppleWebKit/537.36
(KHTML, like Gecko) Chrome/85.0.4183.106 Safari/537.36" "-"
172.20.0.1 - - [07/Sep/2020:09:55:00 +0000] "GET /favicon.ico
HTTP/1.1" 200 1150 "http://localhost:8088/" "Mozilla/5.0 (Windows
NT 10.0; WOW64) AppleWebKit/537.36 (KHTML, like Gecko)
Chrome/85.0.4183.106 Safari/537.36" "-"
172.20.0.1 - - [07/Sep/2020:09:55:04 +0000] "GET
/orgs/59f148cfc72908cc HTTP/1.1" 200 313 "-" "Mozilla/5.0 (Windows
NT 10.0; WOW64) AppleWebKit/537.36 (KHTML, like Gecko)
Chrome/85.0.4183.106 Safari/537.36" "-"
172.20.0.1 - - [07/Sep/2020:09:55:04 +0000] "GET /5e93c5f5aa.js
HTTP/1.1" 304 0 "http://localhost:8089/orgs/59f148cfc72908cc"
"Mozilla/5.0 (Windows NT 10.0; WOW64) AppleWebKit/537.36 (KHTML,
like Gecko) Chrome/85.0.4183.106 Safari/537.36" "-"
...
Stop the console attachment with Ctrl-P Ctrl-Q key-combination - this way the container will continue running. To get back to command prompt after this, use Ctrl-C as usual.