InfluxDB Out
DashT InfluxDB Out is an “instrument” which is used to start and monitor a background streamer which takes all or selected data received or created by DashT and formats that data so that it is compatible with InfluxDB v2.0 time series database.
InfluxDB Line Protocol to write data is used. Users can select from two different methods: either direct streaming into InfluxDB 2.0 HTTP server or writing to a Line Protocol-format file which is can be later imported in the database using InfluxDB 2.0 web user interface.
Since the Line Protocol-format file method does not require the presence of InfluxDB v2.0 server instance while underway, it is easier to understand so let’s explain it first.
Line Protocol File
This is the easiest way to get started since no running Influx DB 2.0 server is needed while data is collected. It is also the fastest way to collect data for InfluxDB, limited only by the writing speed of your hard disk. Potentially, but depending of your boat’s instruments, over thirty different types of measurement values received by various Dashboard Intstruments can be saved, some of them a few times per second. Since modern disks can easily store data with these rates and volumes, it is the safest option what comes to the performance and the ease of use.
Start your OpenCPN v5.2 or superior with DashT plug-in.
Open the DashT Preferences dialog and create a new instrument panel with a single instrument in it: InfluxDB Out:
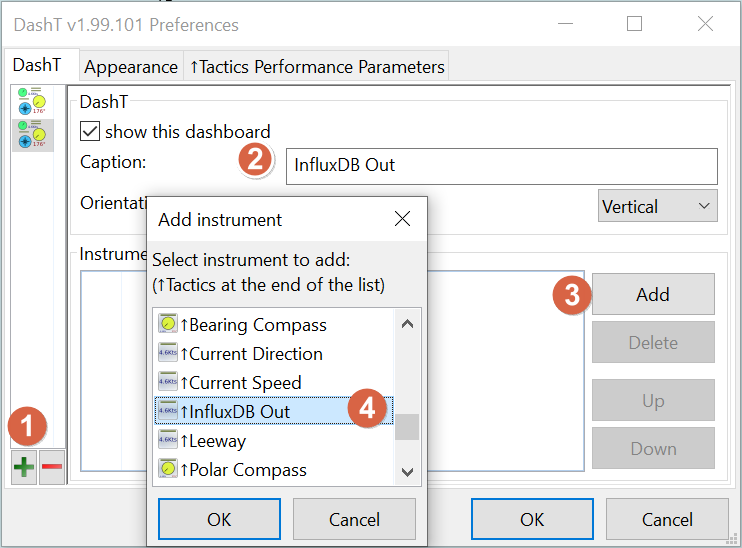
NOTE: Albeit you can have many InfluxDB Out instruments, only the first one is actually doing any streaming - the others would only do monitoring. It can be confusing to remember which one is doing the actual work and one can accidentally delete it… Therefore it is advised to have only one InfluxDB Out instrument, alone in a dedicated instrument panel: if you mix InfluxDB Out with other instruments, and then reorganize those other instruments, the communication and streaming thread can get orphan below the InfluxDB Out while the panel gets reorganized and would halt. There is no way out of the halt condition other than restarting OpenCPN.
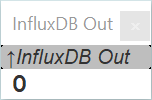
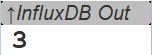
That’s it! Data coming in from OpenCPN (there is always some, like it is giving position data being ) is already collected and a background thread is busy writing those into a file.

Looks small? Well, that’s hundreds of lines written out, after a minute or so 300 lines have been written…
File content
Below is an example of InfluxDB Line Protocol file (small part of it only after a few seconds of running) created by InfluxDB Out. It can be dropped directly into the InfluxDB v2.0 data collection user interface as it is.
NOTE: InfluxDB v2.0 will asks you the precision of the timestamps: it is in milliseconds as you can see in the data of the excerpt below.
...
navigation magneticVariation=-4.000000 1598810821136
navigation headingMagnetic=145.000000 1598810821136
navigation headingTrue=141.000000 1598810821136
navigation speedThroughWater=0.000000 1598810821140
environment,prop1=temperature water=21.600000 1598810821140
environment,prop1=belowTransducer depth=15.400000 1598810821384
environment,prop1=directionTrue wind=20.000000 1598810821384
environment,prop1=speedTrueGround,prop2=tws wind=12.200000 1598810821384
...
You may be wondering about the format, where there is a resemblance with Signal K data. That is true, Signal K data model is used but what you see is created by a DashT InfluxDB v2.0 database schema. The purpose of this schema is to make both writing and reading of data more efficient, one would be drilling first to environment data, then wind and only after seeking directionTrue. This allows data to be organized in continuous
chunks, thus speeding the operation and reducing the number of reads needed to reach the value searched for.
NOTE: If you are a database specialist or otherwise do not agree with the DashT InfluxDB v2.0 database schema, the good news is that it is totally configurable in the JSON-format configuration file described below. One can, if it is the wish, to move use single Signal K key in CamelCase, in order to be compatible with Signal K server node way of writing data in a database. No tests, however, have been carried out without applying a schema in write / read operations.
File location
Windows: C:\ProgramData\opencpn\plugins\dashboard_tactics_pi\streamout
Linux: ~/.opencpnplugins/dashboard_tactics_pi/streamout
Backup copies
At each start of InfluxDB Out an existing streamout InfluxDB 2.0 line protocol file is renamed as streamout_bup_YYYY-MM-DD_hh:mm:ss where the YYYY-MM-DD_hh:mm:ss is the time of the backup and not the time of the data inside that file:
To find out the period of the data inside a backup file open it an use on-line service accepting timestamps in milliseconds such as https://www.epochconverter.com to convert the timestamp of the first and last line.
Importing to InfluxDB
InfluxDB has multiple file import sources available in its graphical user interface. Typically you would select Load Data -> Buckets -> Add data and then drag and drop the line data file into the file selection box.
NOTE: The above would work without a problem for a file registered during a regatta or such. Files registered over longer period may grow too big for the InfluxDB network based file loader (limit is, as this is written 10MB file maximum). In this case one need to split the big file smaller. For Windows, one can use simple FileSplitter, while for Linux on can say
split -l 80000 input_file output_file. To give you and idea, 48 hours of continuous navigation creates a line protocol file of size 50MB, approximately.
CAVEAT: in splitting a line protocol file by megabytes (size) the last line of the each file and first line of the next one are split blindly in two and, consequently InfluxDB would detect a line protocol error and refuse to upload the file. The solution is to cut the last, incomplete line of each file and complete the first line of the next one with it. This sounds cumbersome but it is not that much of work. However, prefer the per line splitting method if you can.
Configuration file management
The configuration file and the database schema are in a single JSON-file, located in the same data directory indicated above. It can be edited. There is a template file located in the plug-in’s program directory dashboard_tactics_pi from where it should be copied (and not modified) if a need arise - see below for HTTP template file for more details.
It is possible to have more than one configuration settings and, consequently more than one database schema - you can add tags, or otherwise modify the schema to facilitate the data browsing. You can also switch between file-based and http:// based streaming operation. But only one configuration file can be used at a time. Select its name in the ini/conf file.
HTTP Streamout
HTTP Streamout into InfluxDB v2.0 is needed if you are using Grafana visualization when underway, or if you want to use DashT Line Charts which are Grafana type (modestly imitating) instruments but embedded in Dashboard, using data retrieved from InfluxDB v2.0 database and applying aggregation functions implemented by InfluxDB v2.0 on that data.
Make a copy of a template file streamout_template_http.json from:
Windows: C:\Program Files (x86)\OpenCPN\plugins\dashboard_tactics_pi\data
Linux: ./share/opencpn/plugins/dashboard_tactics_pi/data
and place it here, with this name (or change the name to your liking):
Windows: C:\ProgramData\opencpn\plugins\dashboard_tactics_pi\streamout_http.json
Linux: ~/.opencpnplugins/dashboard_tactics_pi/streamout_http.json
Select the above path and name in the ini/conf file.
Modify streamout-http.json file to contain your InfluxDB 2.0 connection parameters, see Set Up InfluxDB:
"org" : "myorg", // HTTP: Influx DB organization name
You have seleced an organization (boat?) name in InfluxDB 2.0. Type it here in place of myorg - exactly as you defined it in InfluxDB 2.0 user interface.
"bucket" : "mybucket", // HTTP: Influx DB bucket to write
Data is written in buckets of InfluxDB 2.0. Create one if not yet done and give its exact name here.
"token" : "ToLdk3DNs3PqbKNS2hdZMure......E0eu4lE0OUWRt8w=="
Tokens are unique, per each server, and sometimes even per each bucket in it. Go to Tokens-tab in Settings of InfluxDB 2.0 user interface and generate one. Copy the new token into clipboard and paste it between string quotes in the configuration file. Do not allow a carriage return, it must be a single line string.
Now you are ready to try. But if it does not work? There is debugging information available in OpenCPN log file, read more about debugging below. But before that you must turn the debugging on in the configuration file and restart the DashT InfluxDB Out “instrument” (often it is easier to restart the OpenCPN):
"verbosity" : 3 // 0=quiet,1=events,2=verbose,3+=debug
Conversions
Stream from VDR
It is possible to convert old OpenCPN Voyage Data Recorder plug-in log files into a historically time stamped data in InfluxDB v2.0 time series database by making a VDR data play back.
The following major criteria must be fulfilled:
The data contains GPS timestamps
You do not have Calculate SOG- option in OpenCPN Preferences checked
The resulting database entries are organized with timestamps generated by DashT which gets its time synchronized at every arrival of the GPS data with a time stamp. In between, the time tick is running with the CPU clock, until getting synchronized again. While the intermediate data arrival rate is dictated by the playback speed in the VDR player, the error in successive data sentences is not cumulative throughout the file, only between two GPS time data sentences.
NOTE: The time shift backwards is possible because if DashT detects a difference greater than five seconds between the local CPU time and GNSS (like GPS) provided time it switches to use the GPS time for timestamps and calculations. This shift is announced in the OpenCPN log file only, there is no pop-up message - taking it as granted that in off-shore use the racer is not necessarily synchronizing his/her PC with the satellite provided time anyway. Depending of the ratio of the time data arrival, this may lead to a short range with time values being the current (CPU) time before the data is timestamped with the “historical” timestamps. If this is an issue, remove those few tens of lines from the line data file manually, before uploading into the InfluxDB v2.0.
Debugging
The output file, streamout is a text file which can be visualized and its filling can be followed up with the command line tools.
It is possible to increase also the verbosity level of the log messages, values 3 - 5 makes more debug printing out in the OpenCPN log file.
Level 4
Verbosity level 4 is printing out every second the status of the FIFO queue between the streamer instrument and the file writing and data communication thread, which is useful if buffer overrun is suspected
On Windows PowerShell:
PS C:\ProgramData\opencpn\plugins\dashoard_tactics_pi>
Get-Content ./streamout -Wait -Tail 20
PS C:\ProgramData\opencpn>
Get-Content ./opencpn.log -Wait -Tail 20
On *nix systems:
tail -f ~.opencpnplugins/dashboard_tactics_pi/streamout
tail -f ~.opencpn/opencpn.log
Level 5
Level 5 is useful to debug issues with the HTTP, printing out the entire header and data POST/OPTIONS message (one may want to reduce the number of lines to be sent per message in this case)